Open to Data Analyst opportunities

DATA ANALYST • BUSINESS INTELLIGENCE

Turning data into clear business decisions.

Data Analyst with 5+ years of experience across software, business systems and analytics, with hands-on experience in SQL, Power BI, Tableau, Excel and Python.

5+ Years Experience
SQL Data Analysis
BI Dashboarding
Analytics Overview
•••
BUSINESS PERFORMANCE

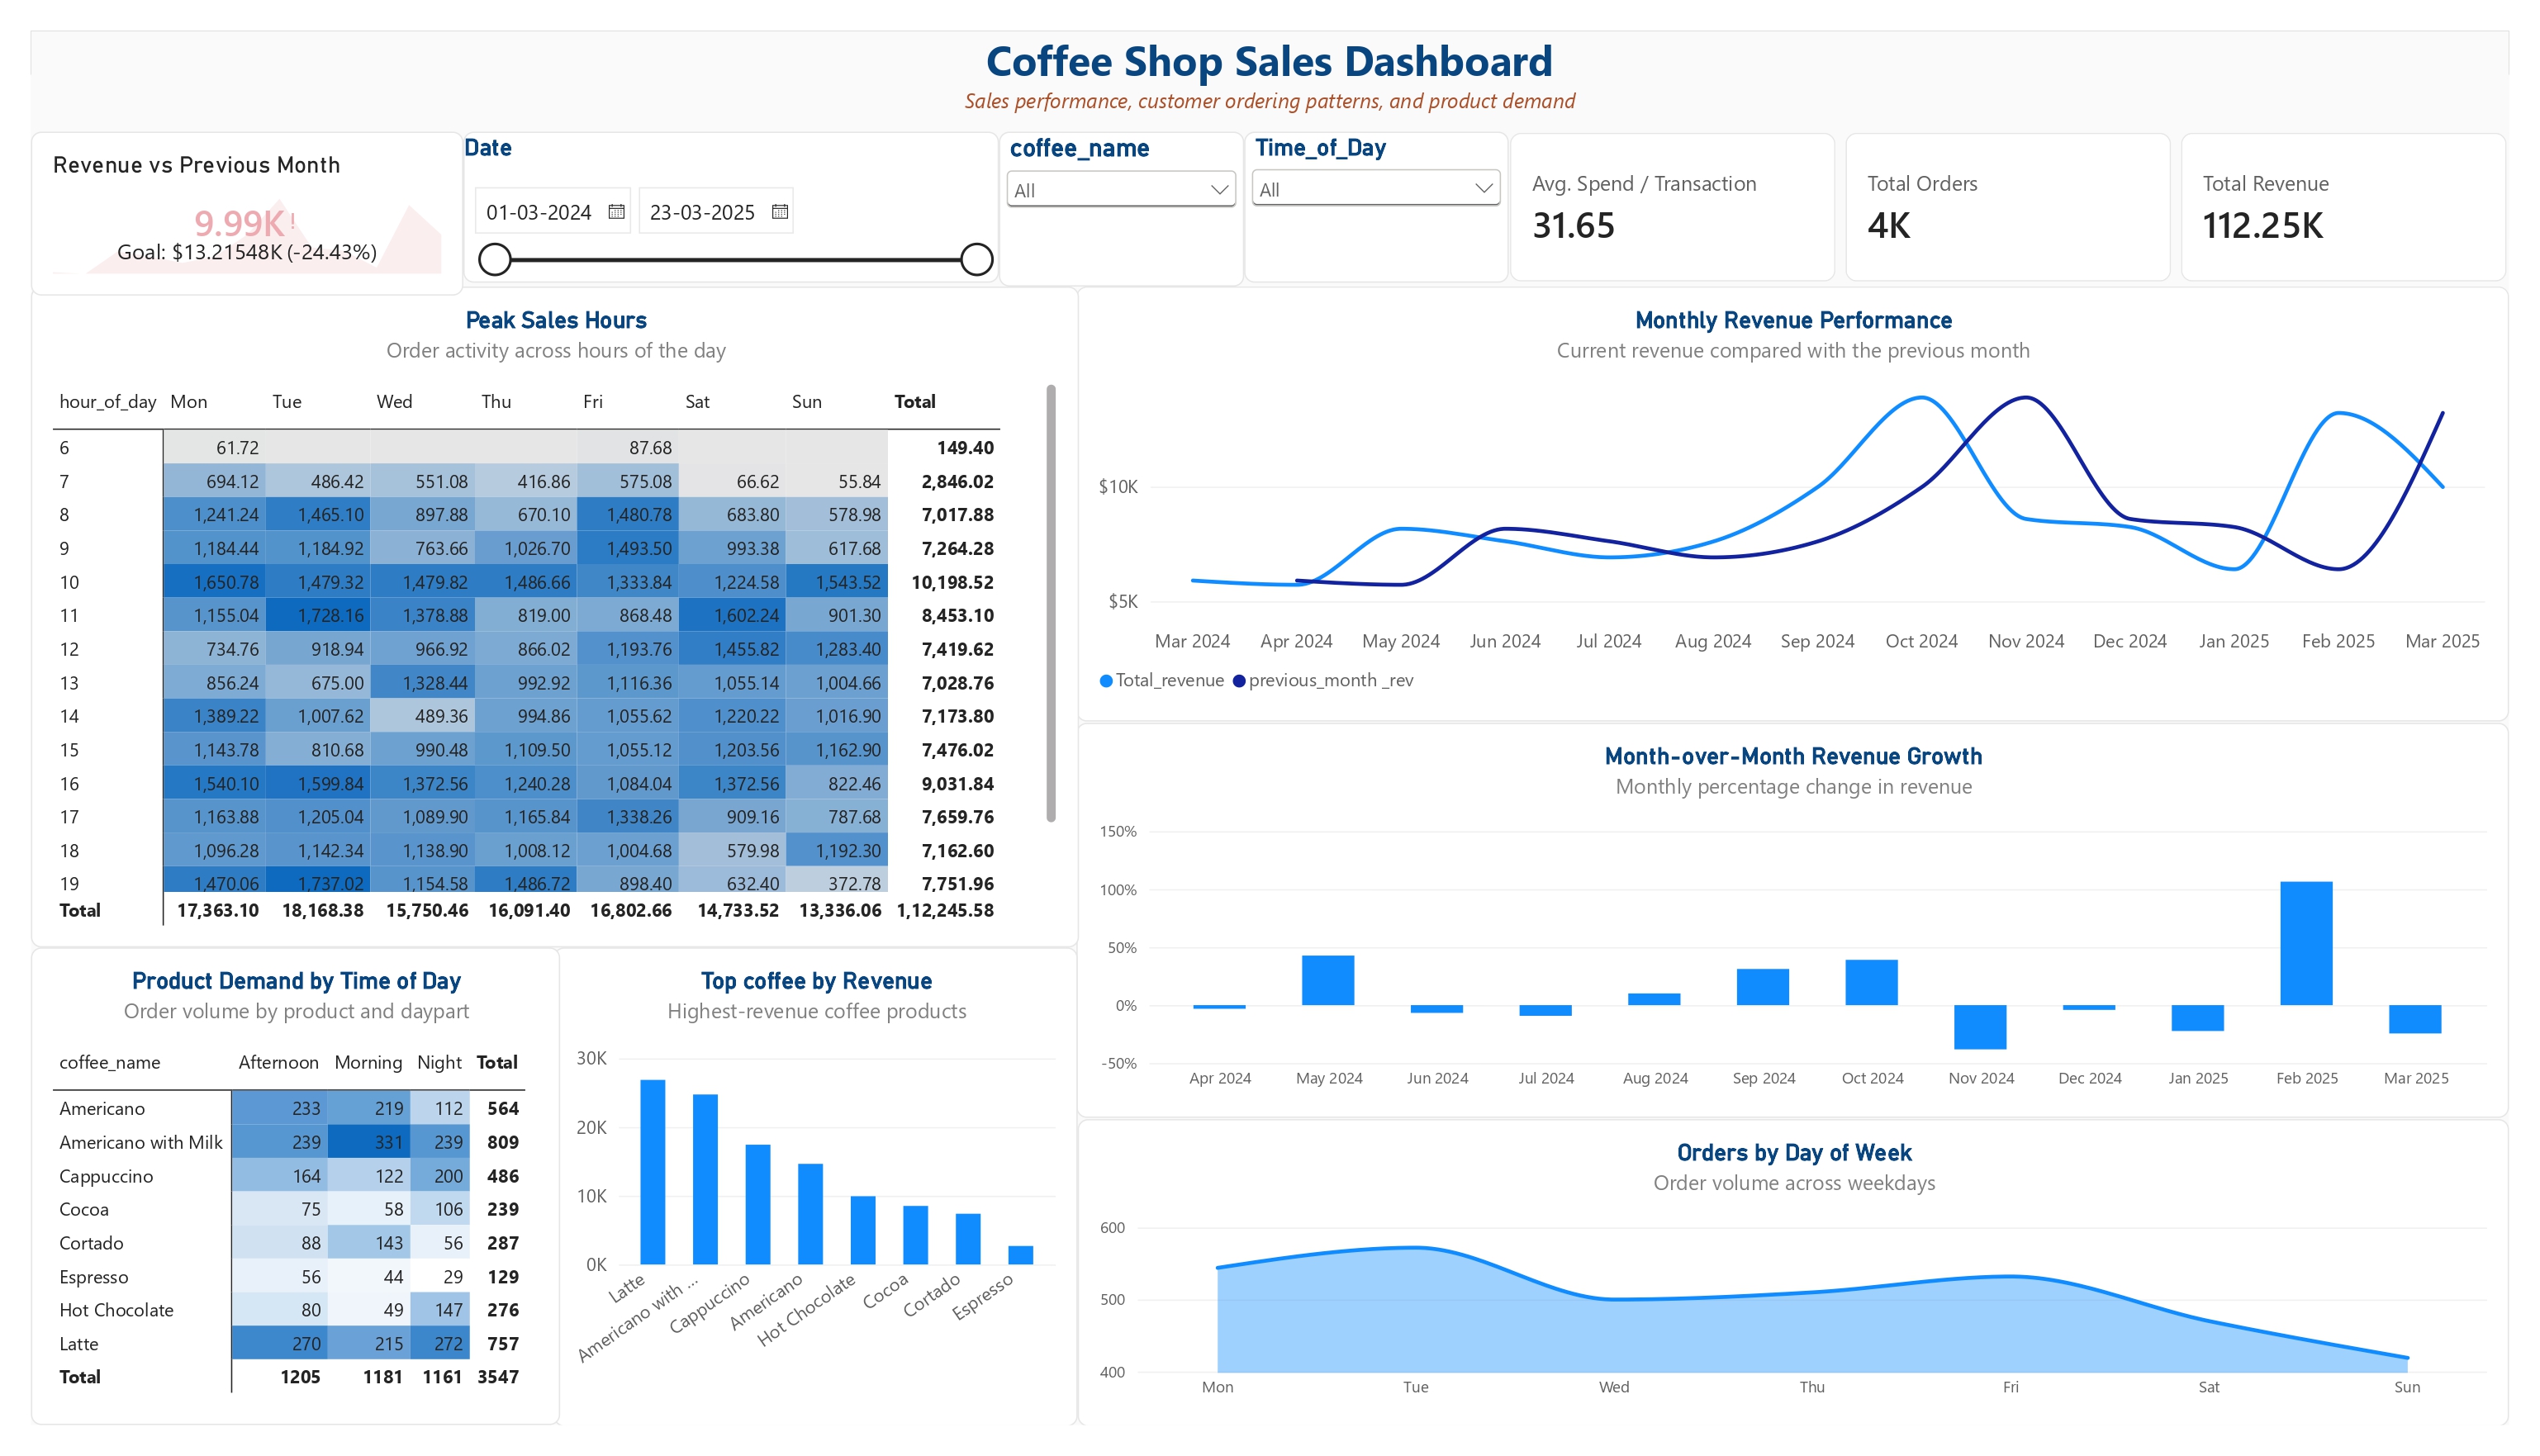
Sales Analytics

2026
Total Revenue AED 84.2K ↑ 12.8%
Orders 3,547 ↑ 8.4%
Avg. Order AED 23.7 Stable
Revenue Trend
Jan Feb Mar Apr May Jun
Top Categories
Latte
86%
Americano
68%
Cappuccino
51%
✦
KEY INSIGHT

Revenue is trending upward with strong weekday performance.

SQL
SQL Analysis
▦
Power BI Dashboards
T
Tableau Visualization
Py
Python Pandas
X
Excel Reporting
01

Analyze

SQL, Python and Excel for cleaning, exploring and understanding data.

02

Model

Transforming raw datasets into structured analytical models.

03

Visualize

Building clear dashboards using Power BI and Tableau.

04

Communicate

Turning analysis into practical business insights and KPIs.

Technical background. Business perspective.

My background combines software engineering, business systems and analytics — giving me a practical understanding of both the technical and business sides of data.

I started my career working with enterprise applications, APIs, SAP integration and Python-based systems. Over time, my work moved closer to business reporting, dashboards and data-driven decision making.

Today, I focus on Data Analytics and Business Intelligence, using SQL, Power BI, Tableau, Excel and Python to turn raw data into useful insights.

5+
Years of professional experience

Software, business systems, analytics and reporting.

05
Core analytics tools

SQL • Power BI • Tableau • Excel • Python

UAE
Based in the UAE

Open to Data Analyst and BI opportunities.

Projects built to answer real questions.

A selection of analytics projects combining data preparation, SQL analysis and interactive business dashboards.

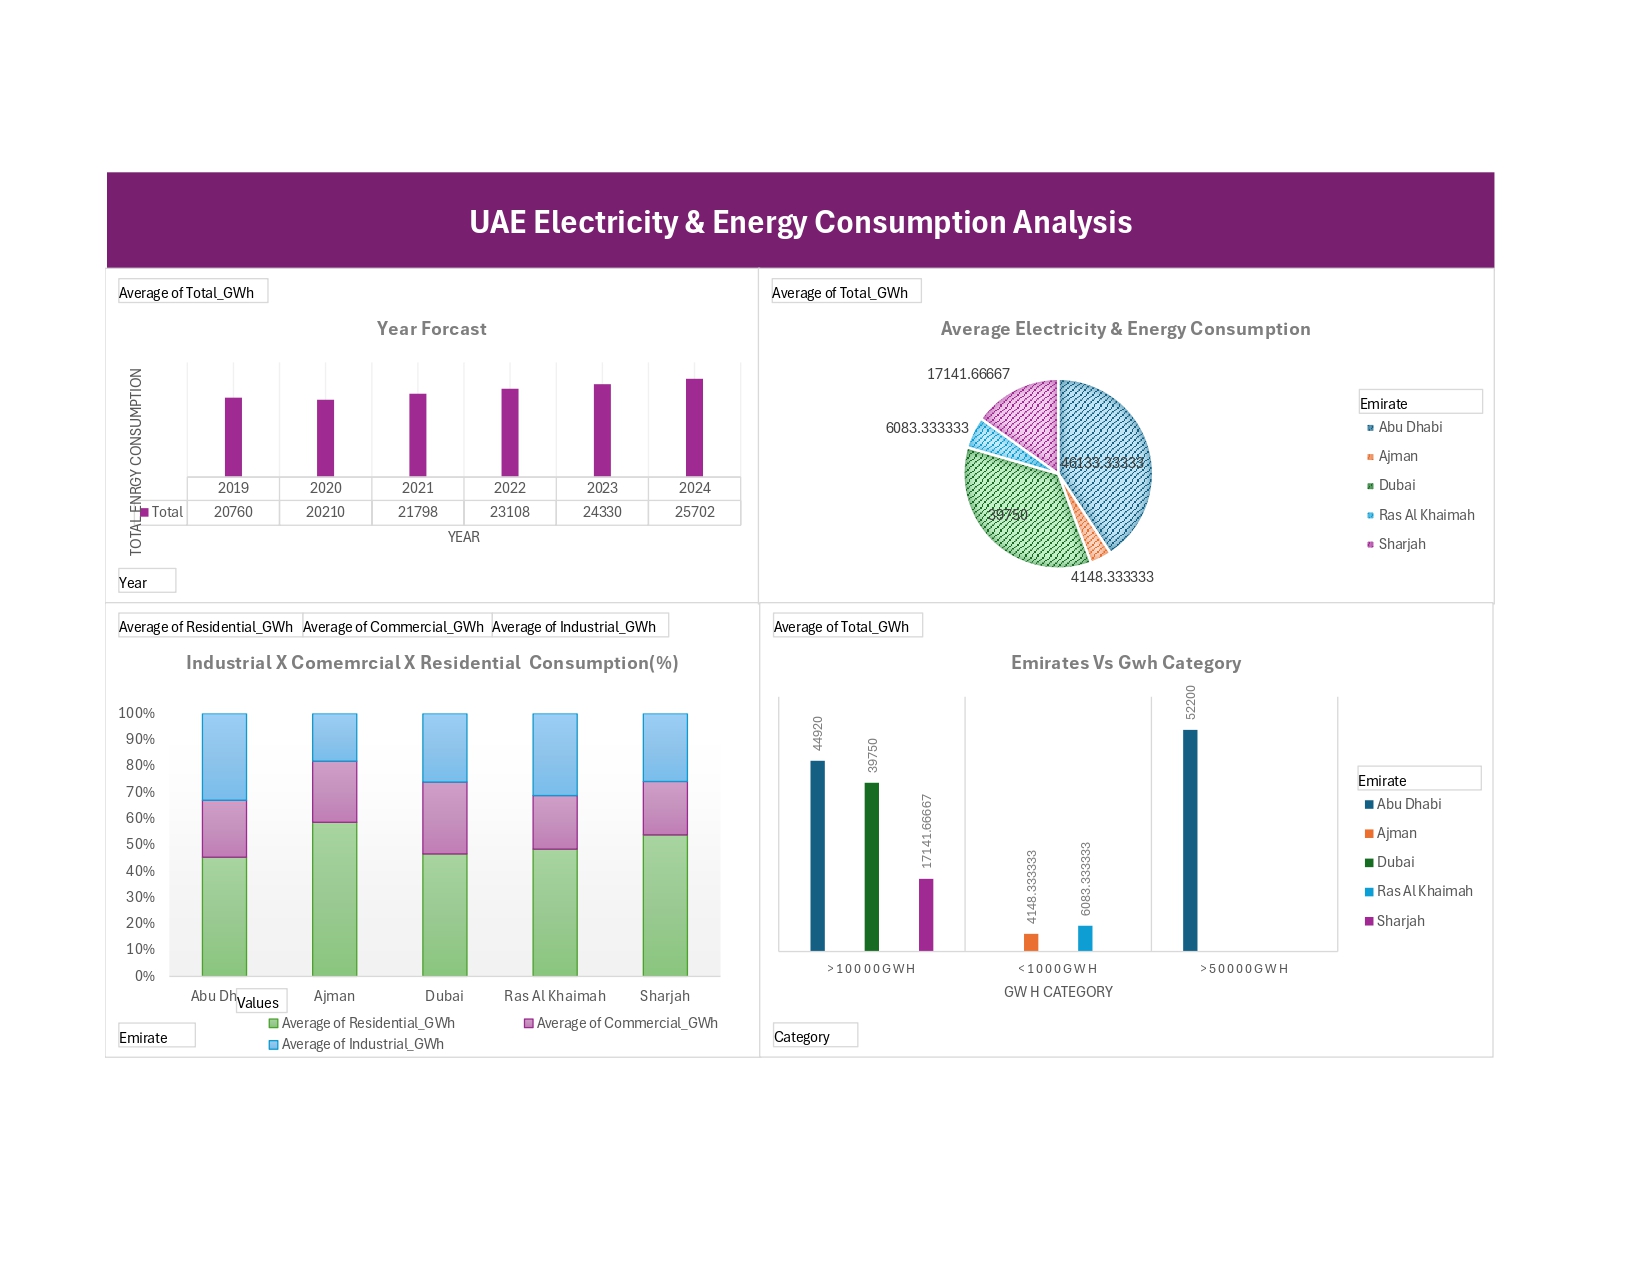
UAE Retail Sales dashboard EXCEL
EXCEL DASHBOARD

UAE Retail Sales Dashboard

Interactive Excel-based dashboard designed to organize data and present business performance through clear KPIs.

View project ↗
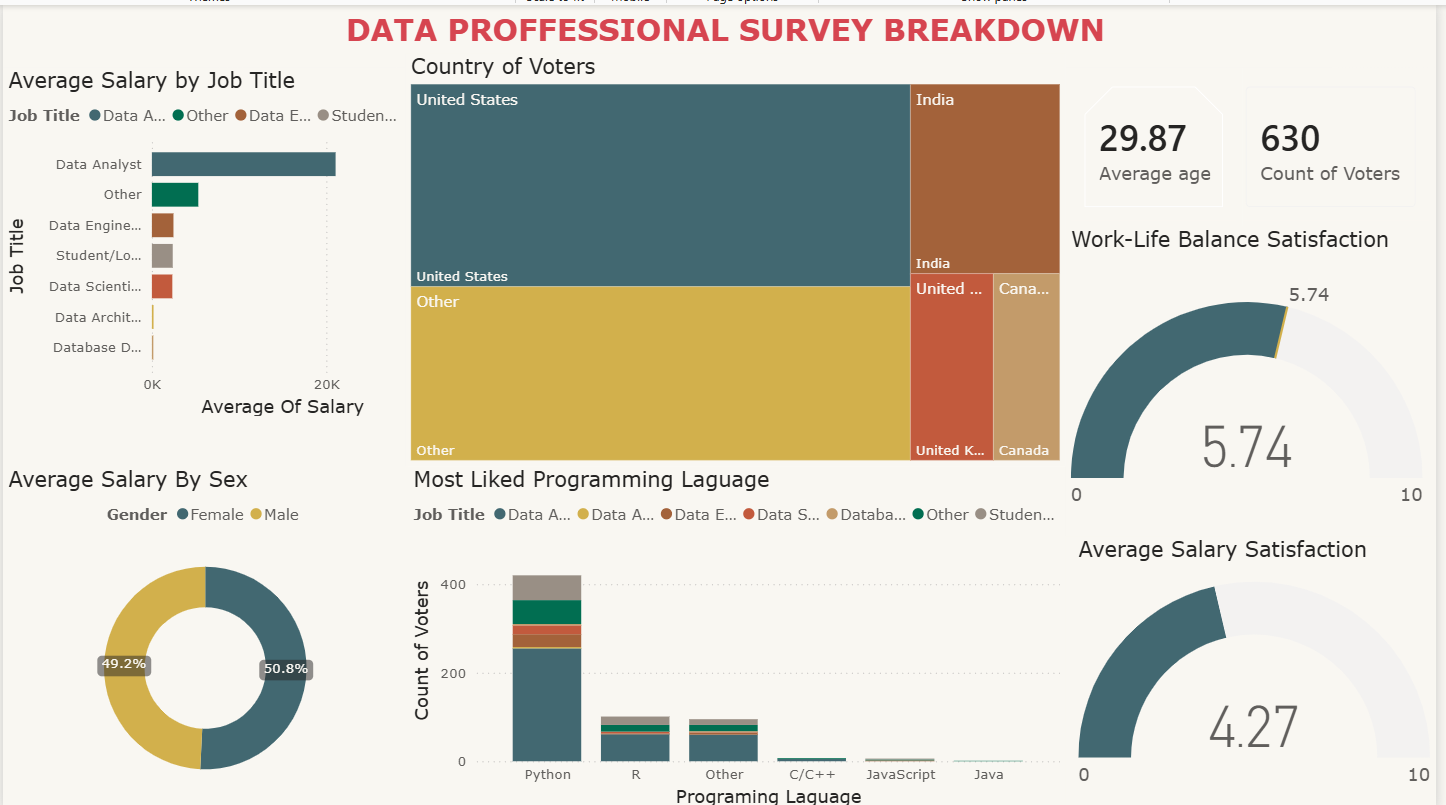
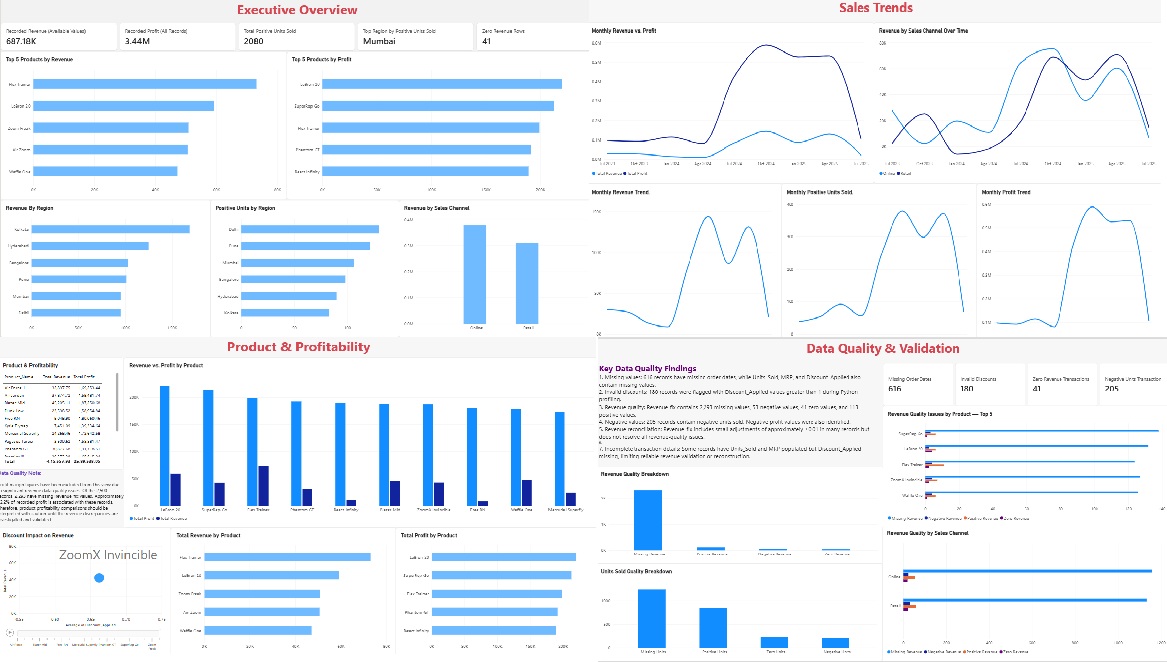
Data Professional Survey dashboard POWER BI
BUSINESS INTELLIGENCE

Data Professional Survey Breakdown

Power BI dashboard exploring survey responses and presenting key patterns through interactive visualizations.

View project ↗
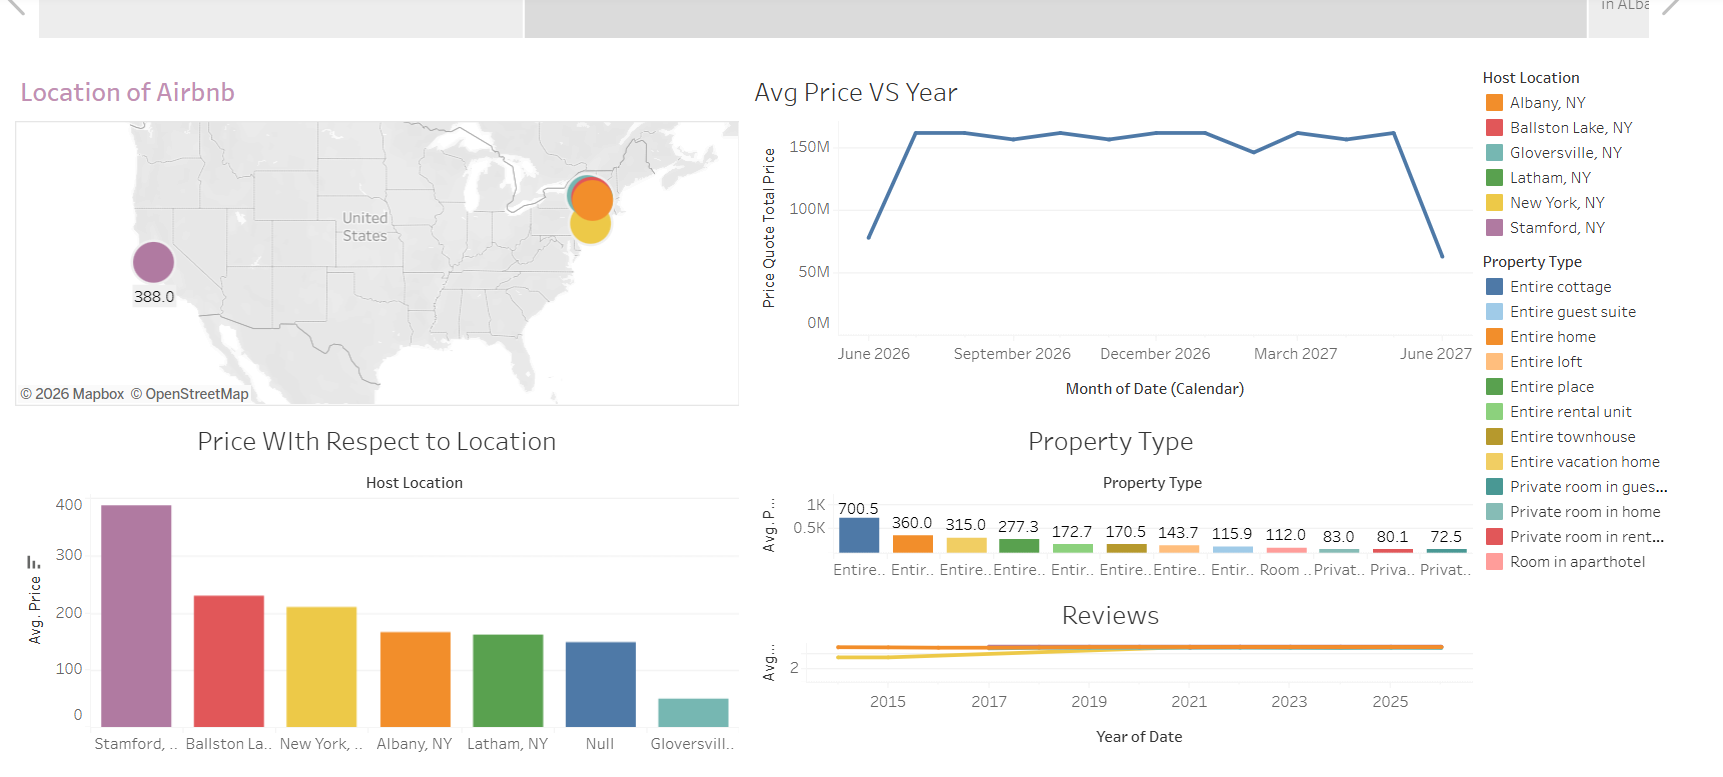
Airbnb Seattle analytics dashboard TABLEAU
DATA VISUALIZATION

Airbnb Seattle Open Data

Tableau project exploring Airbnb listing data through interactive visual analysis and dashboard storytelling.

View on Tableau Public ↗

Tools I use to work with data.

SQL CORE

SQL

Data querying, joins, CTEs, aggregations, window functions and analytical queries.

▦ CORE

Power BI

Power Query, DAX, data modeling, KPI design and interactive dashboards.

T CORE

Tableau

Interactive dashboards, calculated fields, analytical visualizations and storytelling.

X CORE

Excel

Pivot Tables, lookups, conditional formatting, analysis and business reporting.

Py ANALYTICS

Python

Pandas, data cleaning, exploratory analysis, visualization and basic automation.

Zo BUSINESS

Business Systems

Zoho Creator, Zoho Analytics, SAP PI/PO and enterprise application support.

From software engineering to data analytics.

A technical career that gradually moved closer to analytics, reporting and business intelligence.

01
DOLPHIN GROUP

Marketing & Media Coordinator(Data & Reporting)

UAE

Worked with marketing and business data, Power BI reporting, campaign KPIs, project performance dashboards and market/feasibility analysis.

Power BI KPIs Reporting Market Analysis
02
DOLPHIN GROUP

Technical Assistant – Software Solutions

UAE

Supported business applications and processes using Zoho Creator, SAP PI/PO and enterprise systems.

Zoho Creator SAP PI/PO Process Support
03
UNISOFT GLOBAL SERVICES

Software Engineer

2020 – 2023

Developed and supported enterprise applications, SAP PI integrations, APIs and Python/Django-based systems.

Python Django SAP PI APIs

From raw data to useful insight.

01
↓

Collect

Understand the source, structure and business context.

02
✦

Clean

Validate, transform and prepare reliable data.

03
≈

Analyze

Identify trends, patterns, KPIs and relationships.

04
◫

Visualize

Build dashboards that communicate the analysis.

05
✓

Insight

Translate findings into actionable business context.

Looking for a Data Analyst?

I am currently open to Data Analyst, Business Analyst and Business Intelligence opportunities in the UAE.

DATA → INSIGHT Let's build something useful with data.